July 1, 2025

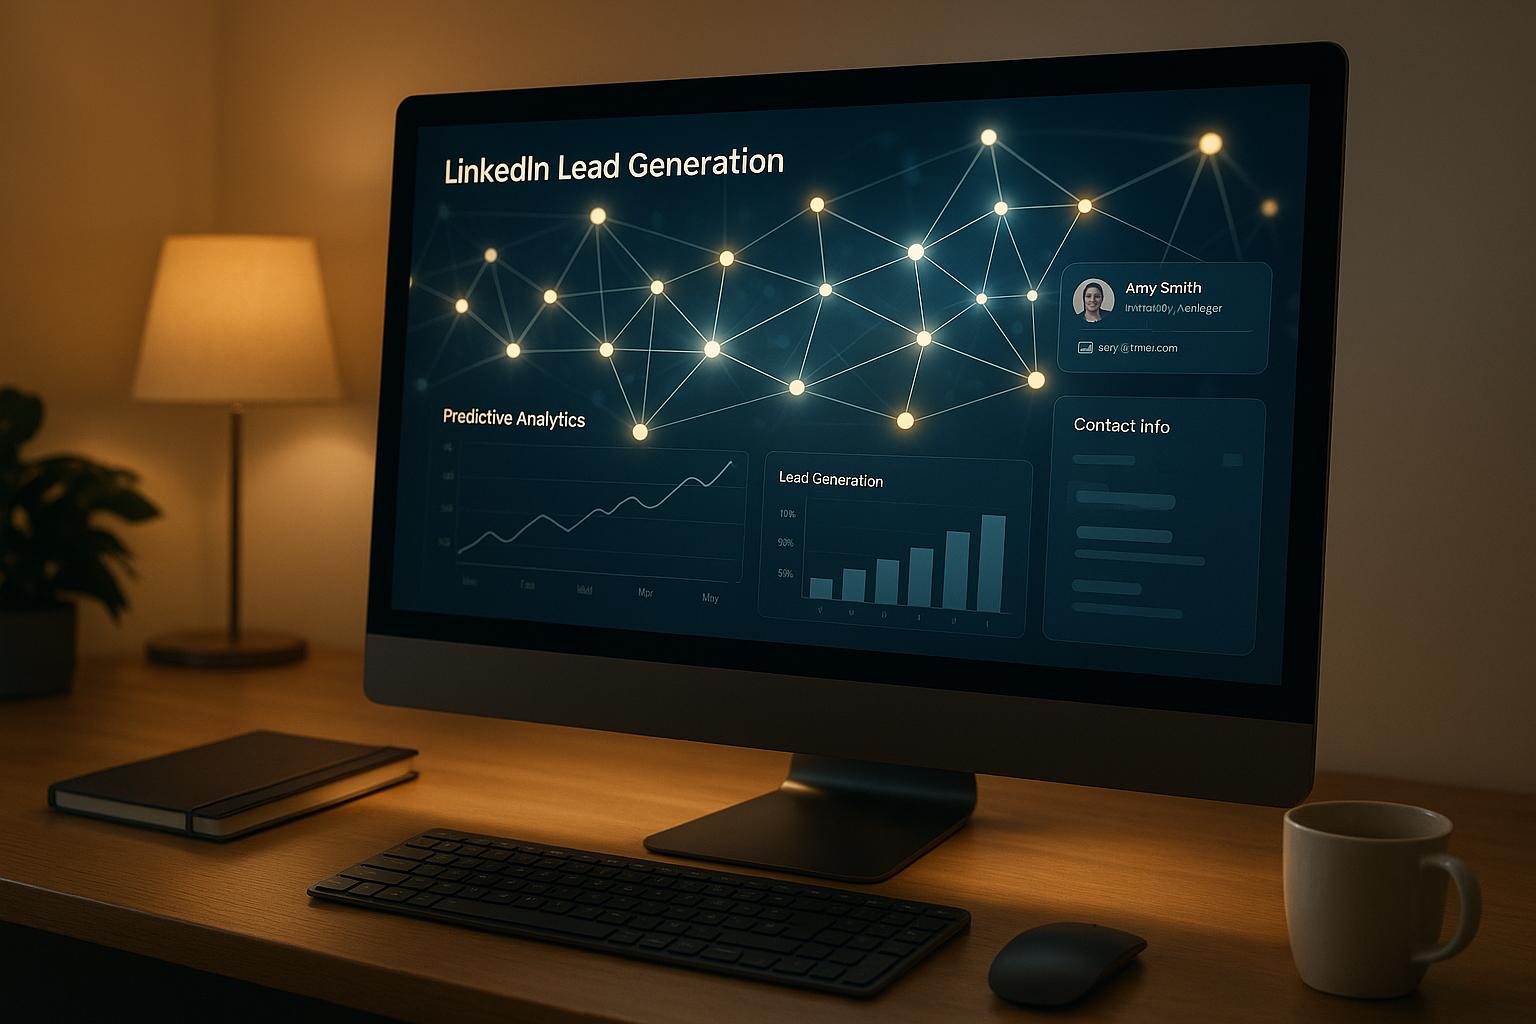
LinkedIn is the go-to platform for B2B marketers. With over 1 billion members, 80% of whom are decision-makers, it offers unmatched opportunities for lead generation and professional engagement. But to maximise results, you need data-driven insights - and that’s where custom dashboards come in.
Bottom line: Custom dashboards simplify LinkedIn marketing, helping you turn raw data into actionable insights for better campaign results.
Tracking the right metrics is critical for effective LinkedIn dashboards. With 94% of B2B marketers relying on LinkedIn for content marketing [3], knowing which metrics to prioritise can be the difference between a successful campaign and one that misses the mark.
Start with engagement metrics, which are at the heart of LinkedIn performance tracking. The platform's average engagement rate by impressions is 5.00% [4], serving as a useful benchmark for assessing how well your content resonates with your audience. Given that 80% of B2B leads from social media come from LinkedIn [4], tracking metrics like likes, comments, shares, click-through rates, form completions, and downloads is essential. These metrics show how effectively your content connects with your audience and converts them into leads. Conversion metrics, in particular, help evaluate your campaign's overall impact.
Next, focus on audience demographics and growth to refine your targeting efforts. Keep an eye on follower growth, job titles, industries, company sizes, and locations. This data not only ensures you're reaching the right decision-makers but also helps shape content that appeals to your ideal customer profile.
Content performance metrics provide insight into which types of posts generate the most engagement and business results. Metrics like video views, article reads, document downloads, and post reach help identify the formats that resonate most with your audience. It’s worth noting that LinkedIn tends to favour posts from personal profiles over company pages [4].
Finally, website traffic and conversion tracking link your LinkedIn efforts to tangible business outcomes. Metrics such as referral traffic, session duration, and conversion rates from LinkedIn visitors help you measure the platform's direct impact on your business goals.
Once you've identified these key metrics, LinkedIn's native tools provide the foundation for tracking them effectively.
LinkedIn offers a range of native analytics tools accessible through your page admin view. These tools help you dive into key performance areas:
While these tools provide valuable insights, they are primarily designed for basic reporting and may lack advanced features like data export, custom reporting, and integration with other systems [7].
To take your LinkedIn dashboard to the next level, consider incorporating external data sources.
Integrating external data sources can turn your LinkedIn dashboard into a robust tool for business intelligence. One of the most impactful additions for B2B marketers is CRM integration. Platforms like HubSpot and Salesforce offer seamless connectivity [5], allowing you to enrich your LinkedIn data with customer insights.
For instance, LinkedIn Sales Navigator integration with CRM systems enables you to track interactions with key accounts and gain a complete view of the customer journey, from initial engagement to closed deals [5].
Website analytics tools, such as Google Analytics, provide another layer of insight. They reveal how LinkedIn traffic behaves on your site - tracking metrics like session duration, high-quality traffic sources, and conversion rates. This data can help you optimise both your LinkedIn content and your website's user experience.
Marketing automation platforms, like Salesforce's Account Engagement (formerly Pardot), can also be integrated via External Data APIs [6]. For example, one company used Pardot data within Tableau CRM to analyse customer behaviour on a specific product, leading to improved lead scoring and better campaign performance [6].
Tools like Zapier, Segment, and Tableau can further enhance your dashboard by connecting website, CRM, and social data into a single, unified view of your LinkedIn performance.
"Integrating external data sources into your CRM expands insight, improves analytics and enhances your business strategy." - HelloLead [5]
Start by integrating your CRM system, then add website analytics and marketing automation data to create a comprehensive picture of your LinkedIn marketing efforts. Companies that actively monitor KPIs through integrated dashboards are nearly twice as likely to achieve their growth targets [8]. Investing in these integrations can significantly improve your marketing outcomes.
Creating a LinkedIn dashboard that transforms raw data into actionable insights can be a game-changer for your marketing strategy. This process connects the dots between selecting the right metrics and designing a dashboard that’s both functional and visually appealing. Let’s break it down.
Start by outlining a clear roadmap and narrowing your focus to 5–7 KPIs that align with your business goals [9]. These KPIs act as a snapshot of your performance, giving you a consolidated view of where your business stands [9].
Choose metrics that are directly tied to your objectives. For LinkedIn marketing, this might include lead generation, brand awareness, or establishing thought leadership. Make sure these indicators can be evaluated both qualitatively and quantitatively [9].
Your KPIs should also reflect the priorities of your team and stakeholders. For B2B marketers, common LinkedIn KPI categories include reach, engagement, lead generation, ROI, and thought leadership [10]. Focus on metrics that directly influence your outcomes, and use LinkedIn analytics or external data sources to ensure they’re accurate and reliable.
With your objectives in place, the next step is choosing the right metrics and matching them with the best visualisations. A marketing dashboard consolidates all your metrics and KPIs into a single, easy-to-digest view [11].
Tailor your dashboard to the audience. For instance, executives often prefer high-level summaries, while marketing teams may need detailed breakdowns of engagement. Understanding what each stakeholder needs will help you provide the right insights.
Your metrics should reflect both current performance and long-term goals. For example, if you’re entering new markets, focus on geographic engagement data. If customer loyalty is a priority, track repeat engagement and content sharing trends.
When it comes to chart selection, choose wisely:
"You need to figure out why you're making a chart in the first place and think about how you can design the chart so that it does that job." – Nick Desbarats, Leading Expert in Data Visualisation [13]
Once your metrics are visualised, focus on designing a layout that allows users to quickly grasp insights.
A well-designed dashboard makes complex data easy to understand. Start by knowing your audience, identifying the decisions they need to make, and defining what success looks like [14]. Keep the focus on a small set of KPIs that align with your goals - too many metrics can overwhelm users [14].
Clarity is key. Use whitespace effectively to avoid clutter and ensure critical data is immediately visible [16]. A grid system can help organise the layout, with consistent column widths and row heights creating a clean, structured appearance [15]. Highlight the most important data points using size, colour, or strategic placement [15].
Choose a colour scheme that’s visually appealing and provides enough contrast to emphasise key information [15]. Build a clear visual hierarchy by selecting appropriate chart types, using purposeful colour coding, and adding benchmarks for context [14]. The goal is for users to understand the dashboard’s insights within seconds.
Incorporate interactivity to make the dashboard more engaging. Filters for date ranges, content types, or audience segments let users explore specific details without feeling overwhelmed [15]. Add drill-down features to allow seamless navigation from high-level overviews to in-depth data [14].
Structure the dashboard to guide users through the most important metrics first. Place critical figures at the top, followed by supporting details and explanations. Regularly test the dashboard with your audience and gather feedback to improve its design [15]. Whether through user interviews or tracking interactions, iterating based on real-world use ensures the dashboard stays relevant and practical [14].
Lastly, make sure your dashboard is responsive and loads quickly, so it works seamlessly across all devices. A well-designed dashboard isn’t just a tool - it becomes an integral part of your team’s decision-making process, helping you fine-tune your LinkedIn marketing strategy.
AI-powered dashboards can transform how you manage and interpret LinkedIn data. They automatically highlight insights, predict trends, and recommend actionable steps, saving you from the tedious task of manually combing through data. With 65% of organisations now leveraging AI and 89% of marketers seeing positive ROI from these tools [19], integrating AI-driven analytics is quickly becoming a must for staying competitive.
Modern AI tools bring a variety of features to LinkedIn dashboards, making them smarter and more efficient:
These features are not just bells and whistles - they deliver measurable results. For example, 84% of sellers report saving at least 30 minutes daily on routine tasks with AI [18], and 88% of sales executives note a strong impact on sales ROI [18]. Early adopters of LinkedIn Accelerate in 2025 saw a 15% boost in campaign creation efficiency and a 52% reduction in cost per action by using AI to analyse LinkedIn Page data, past ad campaigns, and product URLs [17].

Autelo takes LinkedIn analytics up a notch by addressing common challenges and enhancing dashboard capabilities. Its AI-driven tools seamlessly integrate with your existing business intelligence systems, offering tailored recommendations that make your data more actionable.
With Autelo, you can bypass hours of manual analysis thanks to its AI Dashboard Assistant. Simply ask about performance trends, and it provides actionable suggestions based on your metrics [20].
Dynamic writing suggestions are another standout feature. Autelo analyses past performance data and real-time trends to recommend content topics and strategies that are more likely to engage your audience [20].
Smart Search functionality simplifies workflows by instantly retrieving important documents or metrics from your integrated platforms [20].
Autelo also excels in combining data sources. By syncing with your CRM and other sales tools, it enriches LinkedIn analytics with customer data, sales conversations, and other business insights. This integration refines customer personas and content strategies, ensuring your LinkedIn efforts align closely with actual customer behaviour. It even automates persona creation by analysing content performance alongside CRM and sales data [20].
For B2B marketers looking to adopt AI-powered LinkedIn dashboards, starting with clear goals and measurable KPIs is essential [19]. The goal is to enhance decision-making with insights that would be hard to uncover manually, giving your LinkedIn strategy a sharper edge.
Once you've set up your custom dashboards and tapped into AI-powered insights, the next step is turning that data into actionable strategies. LinkedIn, in particular, offers a wealth of data that can reshape your B2B marketing efforts. With up to 80% of B2B marketers' social media leads coming from LinkedIn [23], effectively interpreting this data can make a noticeable difference to your results.
Your dashboard metrics hold the key to identifying gaps and fine-tuning your campaigns. By analysing metrics such as impressions, reach, click-through rates, lead form completions, and conversion rates, you can pinpoint what’s working and what’s not [21].
To dig deeper, segment your data. Break it down by audience demographics, device usage, or funnel stage to uncover specific areas for improvement [21]. For instance, if mobile performance lags behind desktop, you might need to tweak your creative formats or optimise your landing pages for mobile users.
Content performance is another area to scrutinise. Look at metrics like clicks, reactions, comments, and shares to identify which formats resonate most with your audience [1]. If videos consistently outperform static images, consider reallocating resources towards video production. Similarly, experiment with posting times and frequencies to see how they affect engagement [23].
"Prioritising content that drives comments and interactions within LinkedIn, rather than linking out, will enhance both follower engagement and performance in LinkedIn's algorithms." - Ibby Hussain, Vice President of Digital & Creative at Vested [22]
Don’t stop at surface-level insights. Link your LinkedIn data to your CRM system to assess lead quality. Are your leads turning into meetings, proposals, or deals? This integration helps you evaluate the true value of your campaigns and audience segments, enabling smarter budget decisions [21].
Remember, LinkedIn only stores performance metrics for 365 days [2]. To maintain historical comparisons and track trends, set up regular data collection processes.
Your LinkedIn dashboard also provides a window into your competitors’ strategies, offering valuable benchmarks to gauge your own performance. Competitor analytics reveal insights like follower growth, engagement rates, and top-performing content from the past 30 days [1].
For example, tracking follower growth can show how your audience-building efforts compare to others. If competitors are gaining followers faster, study their content strategy, posting frequency, and engagement tactics for inspiration.
Engagement rates offer another useful benchmark. The average engagement rate by impressions on LinkedIn is 5.00%, a 30% year-over-year increase [4]. Small businesses often achieve higher rates (4–7%), while large enterprises may see lower rates (1–2%) but with greater total engagement volumes [4]. Use these figures to evaluate your own performance.
Content gap analysis is particularly insightful. Look at competitors’ top-performing posts to identify topics they excel in, then find areas they’ve overlooked [24]. Addressing these gaps with well-researched, authoritative content can position your brand as a leader in your industry.
Industry benchmarks provide further context. B2B companies often enjoy higher engagement rates than B2C businesses, though results vary by industry, content type, and audience size [4]. Use these benchmarks to set realistic goals and refine your strategy over time.
Regular reporting ensures your dashboard insights lead to continuous improvement rather than sporadic adjustments. Create standardised dashboards that align with your campaign goals, keeping layouts clear and easy to interpret [21].
When building reports, prioritise metrics like conversion rates, cost per lead, and lead quality over vanity stats [21]. Define clear success criteria for each campaign and track your progress against them.
"If you cannot measure it, you cannot improve it." - Lord Kelvin [23]
Automated reporting tools can save time and ensure consistency. Set up alerts for major performance changes so you can respond quickly to both opportunities and challenges. This proactive approach helps you avoid costly mistakes and capitalise on successful campaigns more effectively.
Consistent reporting also reveals the long-term effects of your strategy. Since LinkedIn campaigns often involve longer sales cycles typical of B2B marketing, tracking results over time can uncover patterns that aren’t immediately obvious.
Custom LinkedIn dashboards can turn a sea of raw data into meaningful insights that help B2B marketers make smarter decisions. With over 65% of organisations now using generative AI in at least one business function [25], integrating advanced analytics tools is no longer optional - it's a necessity to stay competitive.
To truly benefit from LinkedIn dashboards, it's essential to focus on actionable insights rather than getting distracted by vanity metrics. The real power of a dashboard lies in its ability to convert data into intelligence that drives measurable outcomes.
By integrating LinkedIn data with CRM systems, marketing automation tools, and web analytics, you can map out the entire customer journey. This approach helps track prospects from their first interaction to final conversion, offering a clear view of campaign ROI and lead quality.
AI-powered analytics take your dashboard to the next level. These tools can process massive datasets to identify trends, customer preferences, and performance metrics that might otherwise go unnoticed [28]. Beyond crunching numbers, AI can also recommend specific actions [25], giving businesses the agility to respond to market shifts in real time.
Research shows that data-driven strategies lead to better ROI [26][27], and AI adoption in sales teams is expected to grow by 155% [25]. This shift towards hyper-personalisation - where AI anticipates customer needs and crafts tailored experiences - is revolutionising B2B marketing.
To keep your dashboards effective, regular monitoring and updates are essential. Focus on metrics that align with your goals, such as conversion rates, qualified leads, and customer lifetime value, to ensure your data translates into meaningful business results.
Start building your LinkedIn dashboard by setting clear objectives and refining your approach over time. Begin with well-defined goals and KPIs, such as lead generation targets, pipeline velocity, customer acquisition costs, and return on marketing investment [30].
Choose tools that match your requirements in terms of integration, reporting, and ease of use. Look for features like predictive analytics, automated insights, and seamless compatibility with your existing tech stack [30].
Adopt a test-and-learn approach. Use A/B testing and controlled experiments to validate your LinkedIn strategy. Keep dashboards outcome-focused and schedule regular reviews to spot trends and address anomalies [29].
Consider leveraging tools like Autelo's AI-powered features to enhance your dashboard's capabilities. For example, its Smart Search function allows you to quickly locate documents or metrics across connected platforms, while dynamic writing suggestions help optimise content based on performance data and research insights.
Empower your team with the skills to turn dashboard insights into action. Providing analytics training or bringing in a data specialist can ensure your team interprets reports effectively and translates them into strategies that drive measurable improvements [29].
The key to success lies in constant iteration and optimisation. Regularly assess your AI system's performance, adjust campaigns based on real-time data, and stay informed about the latest advancements in analytics technology [28][30]. Prioritising data quality and compliance through strong governance practices will also safeguard your efforts.
As your business goals and market conditions evolve, adapt your LinkedIn dashboard to stay aligned. By combining strategic planning, the right technology, and a commitment to data-driven decisions, you can build a tool that delivers long-term success in B2B marketing.
Integrating external data sources into your LinkedIn dashboard can add a whole new layer of insight for B2B marketers. By blending LinkedIn's analytics with external data - like industry benchmarks or customer behaviour trends - you gain a more rounded perspective on your performance and the broader market landscape.
This expanded view helps you question assumptions, tailor campaigns more effectively, and make smarter decisions. The result? Better outcomes and a stronger return on investment. With access to diverse, real-time data, your LinkedIn dashboard transforms into a dynamic tool for tracking progress and staying ahead of the competition.
AI-driven LinkedIn dashboards are transforming the way B2B marketers approach their strategies. With the help of AI, you can dive into more refined audience segmentation and gain predictive insights that allow for highly targeted campaigns.
These tools also simplify real-time data analysis, making it easier to spot new trends, fine-tune lead scoring, and tailor content strategies to your audience. The result? Better engagement, improved conversion rates, and a marketing approach that’s both sharper and more efficient.
To make LinkedIn dashboards work effectively for your business, B2B marketers need to zero in on key performance indicators (KPIs) that directly align with their objectives. Start by pinpointing metrics that showcase essential results, such as lead quality, conversion rates, or customer lifetime value.
For LinkedIn-specific data, focus on metrics like engagement rates, reach, and follower growth. These provide a clear picture of brand visibility and how your audience interacts with your content. Choose KPIs that are not only measurable but also actionable and closely connected to your overall strategy. Regularly analyse and adjust these metrics using performance data to keep your campaigns on track and improving.